Target Audience
This blog is targeted toward an audience who has probably heard of EVM and may have a vague understanding of what it is, and has considered if/how they might apply EVM to their projects but does not yet fully understand how to do so.
Introduction
Earned value management. Many people have heard of EVM, but throughout my career in technology consulting and managed services, we have rarely seen EVM used in practice. And that is a shame because, in today’s hyper-focused world of viewing most everything through a financial lens, EVM provides a reliable method of quantifying the effect of key events on a project’s “bottom line”. For example, EVM provides a quantifiable answer to basic questions, such as:
- How does the budget a project has spent thus far compare to what should have been spent?
- If a project encounters issues, what is the revised total budget estimated to fund the project?
- If a project discovers mid-flight that it is over-budget, how much contingency budget will be needed to complete the project?
I suspect one big reason why we have rarely seen EVM in practice is that relatively few project managers and/or service delivery managers feel confident using EVM. And that is understandable, as at first glance EVM seems complicated; there are several EVM-specific terms and mathematical formulae, and it can seem challenging to assign a realistic financial value to project tasks. But in the approximately 15 minutes it takes to read this blog post, you can develop a sufficient understanding of EVM and how to apply EVM in practice.
EVM Basics
Let’s start with an overview of EVM metrics. For most people, a picture is worth 1,000 words, so I created the following color-coded diagram to graphically illustrate EVM metrics.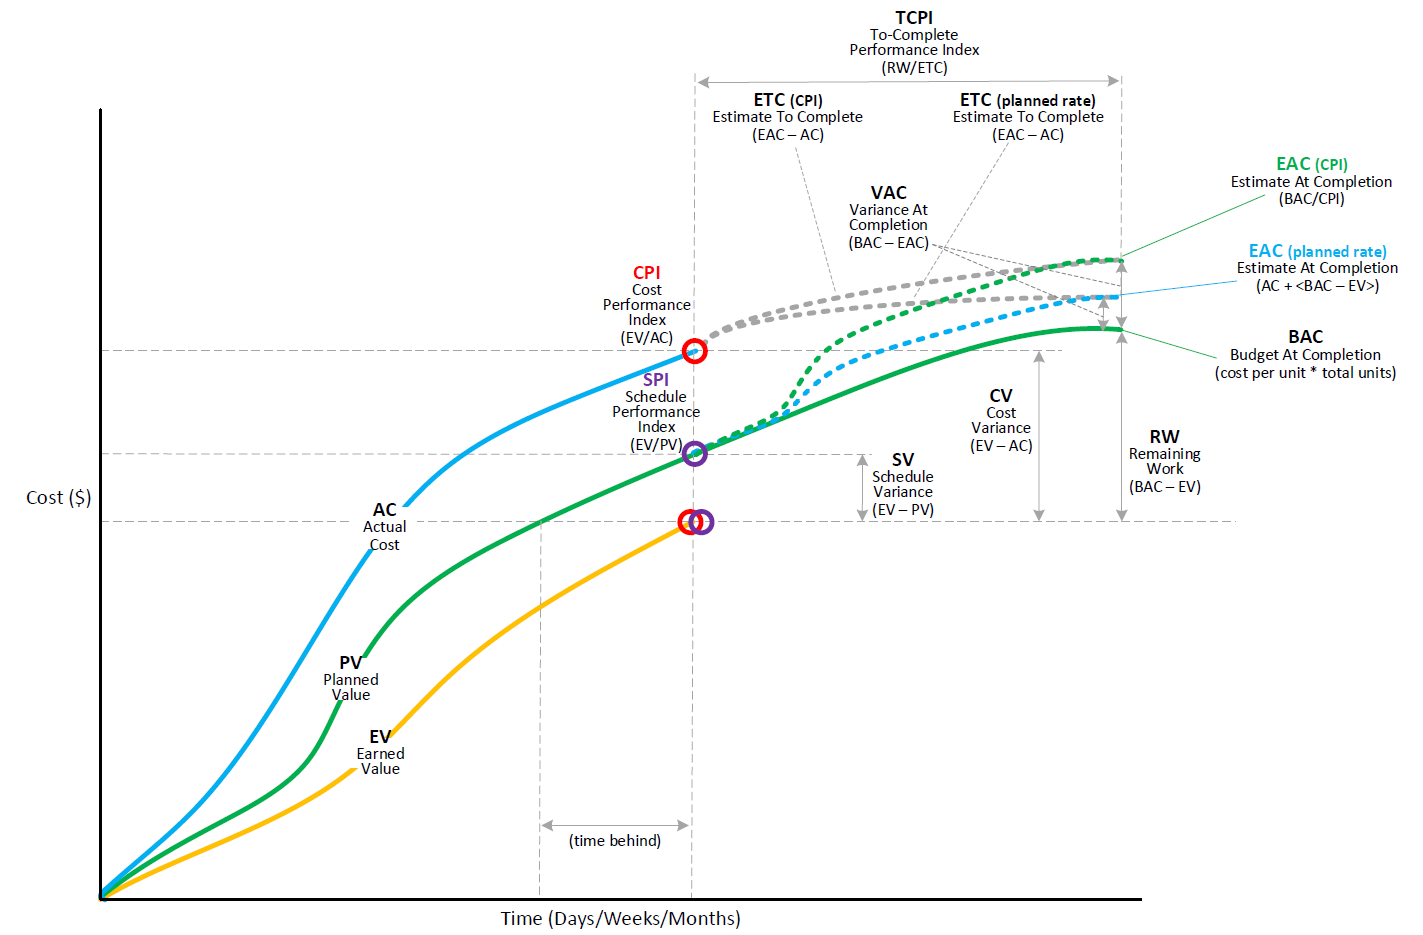
A core tenet of EVM is that all project deliverables, and potentially all project tasks, have an assigned financial value, and a project “earns value” by accomplishing project tasks according to the project schedule. Each deliverable and/or task’s value can be plotted on a line graph that shows the value a project earns over time. With this in mind, let’s highlight a few basic EVM terms:
- Planned value (PV) is the value (e.g. USD or CAN) a project plans to earn by specific dates, based upon task due dates. The sum total of a project’s planned value is called Budget at Completion (BAC); it is the total project budget (not including contingency nor management reserve).
- Earned value (EV) is the value a project has earned by a specific date, typically based upon the completion dates of project tasks.
- Actual cost (AC) is the amount of money (budget) a project has spent by a specific date.
Just by understanding these basic terms, you can infer that the graph above depicts a project that is behind schedule and over budget. As you can see in the graph, these four values (PV, EV, AC, BAC) can be used to calculate several other EVM metrics, which help answer the most common questions regarding project budget and schedule performance. Now that we have defined basic EVM terms, let’s walk through a real-world example to see how it works in practice.
Applying EVM In Practice – Initial Setup
Let’s say Acme Rocket Co. has contracted Road Runner Consulting to design, build, and deploy a new Citrix Cloud solution, via a traditional T&M contract for two consultants at a rate of USD $100/hour, and effort is estimated at 640 hours over eight weeks, for a total contract value of USD $64,000. After reading this blog post the PM decides to use EVM to manage project performance and proceeds to define a list of project tasks, assign resources and values to tasks (or to resources), and create the project schedule. The PM uses MS Project, but since not everyone has MS Project installed, he decides to create a schedule summary table for all stakeholders:
| Task | Effort (hrs) | Start date | Finish date | Total value |
| Virtualization design sessions | 48 | 01/04/2021 | 01/08/2021 | $4800 |
| Virtualization design document | 48 | 01/06/2021 | 01/12/2021 | $4800 |
| Virtualization design QA | 12 | 01/13/2021 | 01/15/2021 | $1200 |
| Virtualization design review | 4 | 01/15/2021 | 01/15/2021 | $400 |
| Virtualization design document final | 8 | 01/18/2021 | 01/18/2021 | $800 |
| Remote access design sessions | 48 | 01/04/2021 | 01/08/2021 | $4800 |
| Remote access design document | 48 | 01/06/2021 | 01/12/2021 | $4800 |
| Remote access design QA | 12 | 01/13/2021 | 01/15/2021 | $1200 |
| Remote access design review | 4 | 01/15/2021 | 01/15/2021 | $400 |
| Remote access design document final | 8 | 01/18/2021 | 01/18/2021 | $800 |
| Build virtualization resource tier | 32 | 01/18/2021 | 01/21/2021 | $3200 |
| Build virtualization user tier | 32 | 01/21/2021 | 01/26/2021 | $3200 |
| Build virtualization hypervisor tier | 32 | 01/25/2021 | 01/28/2021 | $3200 |
| Build remote access tier | 40 | 01/27/2021 | 02/03/2021 | $4000 |
| Test virtualization resource tier | 32 | 01/18/2021 | 01/21/2021 | $3200 |
| Test virtualization user tier | 32 | 01/21/2021 | 01/26/2021 | $3200 |
| Test virtualization hypervisor tier | 32 | 01/25/2021 | 01/28/2021 | $3200 |
| Test remote access tier | 40 | 01/27/2021 | 02/03/2021 | $4000 |
| Prepare pilot deployment | 16 | 02/03/2021 | 02/04/2021 | $1600 |
| Deploy to pilot users | 16 | 02/05/2021 | 02/08/2021 | $1600 |
| Support and optimize pilot deployment | 32 | 02/09/2021 | 02/12/2021 | $3200 |
| Deploy to production users | 16 | 02/12/2021 | 02/15/2021 | $1600 |
| Support and optimize production deployment | 32 | 02/16/2021 | 02/19/2021 | $3200 |
| Transition to IT Operations | 16 | 02/22/2021 | 02/26/2021 | $1600 |
On Jan 28, almost at the project midpoint, the customer project sponsor asks the PM if the project is proceeding on time and on budget. The PM knows the team has just completed all “Design” tasks but has not yet begun any “Build” tasks, and decides to conduct an EVM analysis to answer the sponsor’s questions. The PM proceeds as follows, using MS Excel to create a working table (columns A-F) and an EVM line graph, as illustrated below.
Calculate PV. The PM uses finish dates to calculate the planned value (PV) since those are the dates by which the project expects to “earn” its values. Thus, for the tasks above, the PM identifies the unique finish dates and calculates the running total value for each date. In the working table (below), “EVM Date” is the result of removing duplicate finish dates from the “Finish date” column, and “PV” column = SUMIF($B$2:$B$25,”<=”&C2,$A$2:$A$25) **paste into cell D2 and copy down column D**
Calculate EV. As of Jan 28, the team has just completed all “Design” tasks but has not yet begun any “Build” tasks. In the summary table above, we can see the total value upon completion of all “Design” tasks is $24,000; thus, the earned value (EV) as of Jan 28 is $24,000. To create an EV line in the graph, the PM creates an “EV” column in the working table. **In reality the values in the “EV” column would be based upon actual task finish dates, but for this example, it was simply calculated via an Excel formula.
Calculate AC. The project has two consultants staffed full-time at an hourly rate of USD $100, such that 320 hours have been consumed as of EOD Jan 28, for a total budget spend of USD $32,000; this is the actual cost (AC). To create an AC line in the graph, the PM creates an “AC” column in the working table. “AC” column values created as follows: cell F2 = 0 ($0 on day 0); cells F3-F9 = ((NETWORKDAYS($C$2,C3)+1)*16)*100 (Note: “16” is because the project consumes 16 hours/day, and “100” is the hourly rate).
| Total value | Finish date | EVM Date | PV | EV | AC |
| $4,800 | 1/8/2021 | 1/4/2021 | $0 | $0 | $0 |
| $4,800 | 1/12/2021 | 1/8/2021 | $9,600 | $3,429 | $9,600 |
| $1,200 | 1/15/2021 | 1/12/2021 | $19,200 | $6,857 | $12,800 |
| $400 | 1/15/2021 | 1/15/2021 | $22,400 | $10,286 | $17,600 |
| $800 | 1/18/2021 | 1/18/2021 | $24,000 | $13,714 | $19,200 |
| $4,800 | 1/8/2021 | 1/21/2021 | $30,400 | $17,143 | $24,000 |
| $4,800 | 1/12/2021 | 1/26/2021 | $36,800 | $20,571 | $28,800 |
| $1,200 | 1/15/2021 | 1/28/2021 | $43,200 | $24,000 | $32,000 |
| $400 | 1/15/2021 | 2/3/2021 | $51,200 | ||
| $800 | 1/18/2021 | 2/4/2021 | $52,800 | ||
| $3,200 | 1/21/2021 | 2/8/2021 | $54,400 | ||
| $3,200 | 1/26/2021 | 2/12/2021 | $57,600 | ||
| $3,200 | 1/28/2021 | 2/15/2021 | $59,200 | ||
| $4,000 | 2/3/2021 | 2/19/2021 | $62,400 | ||
| $3,200 | 1/21/2021 | 2/26/2021 | $64,000 | ||
| $3,200 | 1/26/2021 | ||||
| $3,200 | 1/28/2021 | ||||
| $4,000 | 2/3/2021 | ||||
| $1,600 | 2/4/2021 | ||||
| $,600 | 2/8/2021 | ||||
| $3,200 | 2/12/2021 | ||||
| $1,600 | 2/15/2021 | ||||
| $3,200 | 2/19/2021 | ||||
| $1,600 | 2/26/2021 |
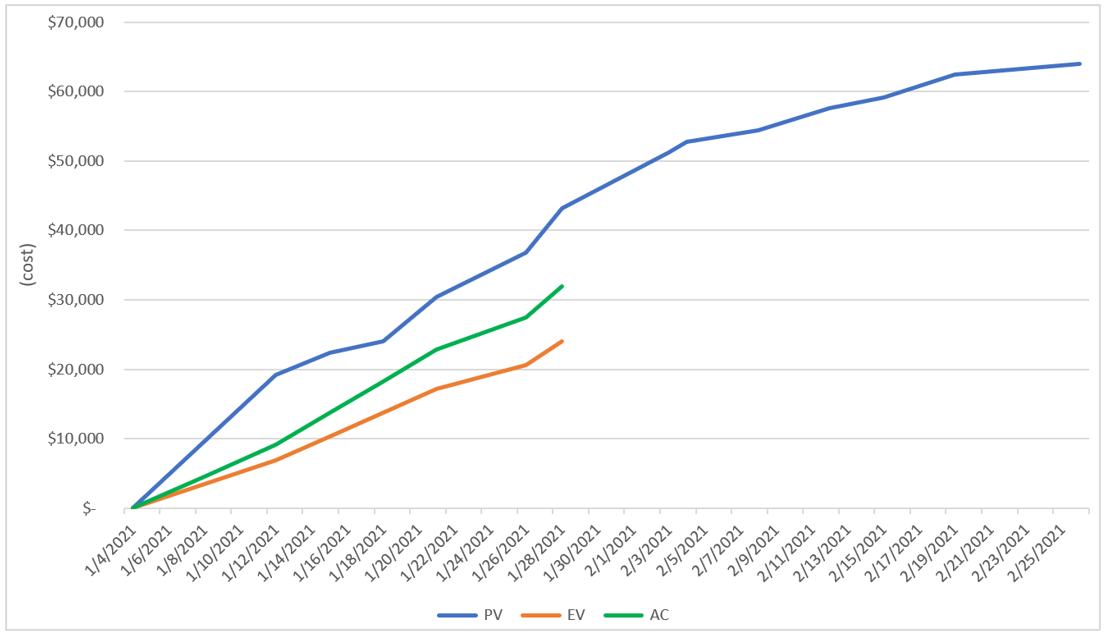
This line graph was created by selecting columns C-F in the working table (“EVM Date”, “PV”, “EV”, “AC”) and using Excel’s chart function to create a line graph.
Applying EVM In Practice – EVM Analysis
Now that we have a basic line graph showing PV, EV, AC, and BAC (total PV), we can calculate other EVM metrics to help answer the project sponsor’s questions; as well, the PM anticipates what the sponsor’s next set of questions is likely to be, such as:
- As of Jan 28, are we under, on, or over budget and schedule?
- Considering how much the project is currently over- or under-budget, what is the revised total budget estimated to fund this project?
- Do we need additional funds (contingency) to complete the project? If so, how much?
We can use EVM metrics to answer these questions, such as CV (cost variance), EAC (estimate at completion), and ETC (estimate to complete). Refer to figure 1 (above) for a review of these metrics, and below we will show how to calculate these metrics.
To determine if we are under, on, or over budget and schedule, we can:
- Calculate CV (cost variance) = EV – AC, or CV = ($8000); i.e. the project is $8000 over budget.
- Draw a horizontal line from the EV as of Jan 28 to the point where it intersects the PV line, and draw a vertical line from that intersection to the X-axis (dates); the gap represents the schedule discrepancy. In this case, the project is 9-10 days behind schedule. **Note that this method is a very good barometer of schedule performance, although it has some flaws, but accounting for those flaws requires more complex formulae.
To estimate the revised total budget needed to fund the project, we can:
- Calculate EAC (estimate at completion; revised estimated budget when the project is complete) by assuming the remainder of the project will proceed as originally planned, or by assuming the level of performance thus far will continue for the remainder of the project; let’s assume the latter (the most common scenario). In this case, EAC = BAC/CPI. Remember that BAC is total PV, i.e. total project budget ($64,000). The CPI (cost performance index) represents how much work is completed for every dollar spent; it measures cost efficiency. CPI = EV/AC, or CPI = 0.75 (24,000/32,000). Thus, we can calculate EAC = $85,333 (64,000/.75); i.e. the revised project budget is $85,333.
To determine if additional funds are needed to complete the project, and how much, we can:
- Calculate ETC (estimate to complete; revised funds necessary to complete the project, beyond what has already been spent) as ETC = EAC – AC, or ETC = $53,333 (85,333 – 32,000). Thus, as of Jan 28, it is estimated that $53,333 is needed to complete the project, beyond what has already been spent ($32,000).
- Calculate VAC (variance at completion; difference between original project budget and revised project budget) as VAC = BAC – EAC (64,000 – 85,333), or VAC = ($21,333). Thus, as of Jan 28, it is estimated that the project will be $21,333 over budget when the project is complete.
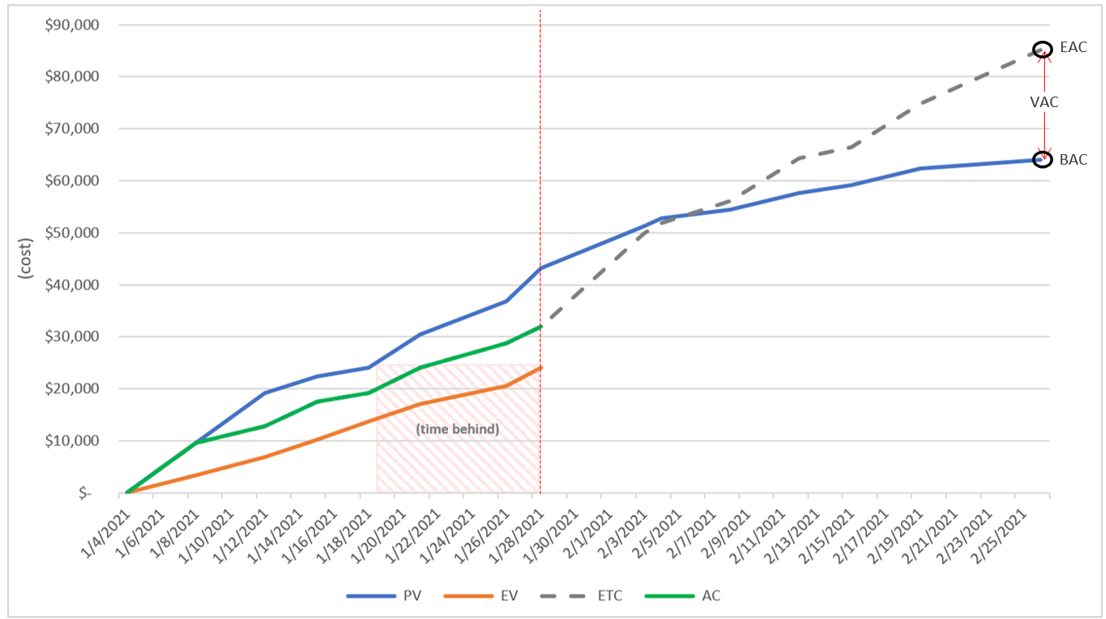
The EVM line graph illustrating the abovementioned EVM metrics for this project is depicted in the following diagram.
Applying EVM In Practice – Conclusions
In practice, it has been our experience that an EVM line graph is very helpful in articulating project budget and schedule performance, and is especially helpful to convey an understanding of the relationships between these metrics.
- The blue line (PV) illustrates how the project was initially scheduled; notice that the total PV is the BAC (i.e. the original project budget).
- The green line (AC) illustrates how much money has been spent thus far, and the dashed line indicates how much more money is needed to complete the project, assuming project tasks continue to be completed at the level of performance that has been achieved thus far.
- The orange line (EV) illustrates the tasks the project has completed thus far; i.e. what the project has “earned” thus far.
- If the project is proceeding exactly as planned, all of these lines overlay on top of each other; i.e. it would look like the graph contained only one line.
As this blog demonstrates, EVM analysis and an EVM line graph provide key project stakeholders with an at-a-glance view of project cost and schedule performance, as well as provides relevant details and a prediction of future performance.
As you can see, using EVM is not overly complicated, and hopefully, this blog demystifies the real-world use of EVM and empowers you with the confidence to try EVM on your next project!