

Policy Tracing is one of the most useful diagnostic tools in the NetScaler toolkit when a policy is not behaving as expected. This includes instances such as firing when it should not, not firing when it should, or producing an unexpected result. Policy Tracing provides real-time visibility into policy engine evaluation and the actions it took during a live transaction.
In this blog, we will focus exclusively on the Policy Tracing feature, covering the full CLI syntax verified against Citrix ADC 13.1/14.1 documentation, how to interpret the output, and practical patterns for getting meaningful data from a trace on a production system.
What is Policy Tracing
Policy Tracing monitors policy evaluation in real time as traffic flows through the NetScaler. It records which policies were checked during each transaction, in which order, and the actions that were taken, organized by feature (Content Switching, Responder, Rewrite, AppFw, etc.) in the exact sequence in which policies were evaluated.
This differs from hit counters (which only indicate whether a policy matched) and logs (which may not show the full evaluation chain), as Policy Tracing provides the complete picture for a specific transaction.
Common use cases include:
- Troubleshooting: identify which policies were applied or skipped when behavior is unexpected.
- Validation: confirm that new or modified policies behave correctly within existing workflows.
- Optimization: identify redundant or conflicting policies that evaluate on every request.
CLI Syntax
CLI (Command-Line Interface) syntax is the specific structure and set of rules that govern how text commands must be written so a computer terminal can understand and execute them. Just like human languages have grammar, a CLI requires you to arrange commands, options, and arguments in a strict, predefined sequence to prevent error messages. Below is the CLI Syntax you will need to follow.
Start policy tracing
The full command signature is:
// start policy tracing Full Syntax
start policy tracing -filterExpr <expr>
                     [-protocolType <protocolType>]
                     [-captureSSLHandshakePolicies <yes/no>]
Parameters
| Parameter | Required | Description |
|---|---|---|
| -filterExpr <expr> | Yes | An Advanced Syntax expression. Tracing data is collected only when the expression evaluates to True. Also clears any previously stored tracing data. If not specified, tracing assumes HTTP context. |
| -protocolType | No | Specify if the virtual server type is not HTTP. Must match the vServer type to which the client is connecting. Example values: SSL, TCP, DNS. |
| -captureSSLHandshakePolicies | No | Set to ‘yes’ to include SSL policies evaluated during the SSL handshake or client hello request. Only relevant for SSL vServers. |
| IMPORTANT: 10 RECORD LIMIT PER PACKET ENGINE |
|---|
| Policy Tracing collects only the first 10 transaction records per packet engine (PE). On a busy system, the buffer fills quickly with background traffic. Always scope -filterExpr tightly, typically to a specific client IP address so the trace captures the target transaction rather than unrelated background requests. |
Stop policy tracing
// stop policy tracing
stop policy tracing
Always stop the active trace as soon as the desired data has been captured (leaving an active trace running on a production system consumes memory and may fill the 10-record buffer with traffic that was not intended to capture).
Show policy tracing
Displays the collected trace data. Three usage patterns:
// show policy tracing
# Display all collected trace records
show policy tracing

# Display brief metadata only
# (client IP, destination IP, transaction ID: useful for finding the right record)
show policy tracing -detail brief

# Display full detail for one specific transaction
show policy tracing -httpTransactionId <id> -detail all
Use -detail brief first when there are multiple records in the buffer. It shows the client and destination IP addresses and a unique transaction ID for each record. Once the right transaction is identified, use -httpTransactionId with -detail all to get the full evaluation chain for that specific request.
Clear policy tracing
// clear policy tracing
clear policy tracing
Removes all collected tracing data from memory. Use this to reset the buffer before a targeted test. This ensures the next run captures only the intended traffic.
Practical Usage Examples
When putting these into action, you will most likely pull from the examples below.
Basic: Trace by Client IP
This is the most common pattern. Scope to the IP address of the client or machine from which the administrator is testing:
// Basic Trace by Client IP
# Step 1: Clear any stale data from previous traces
clear policy tracing

# Step 2: Start the trace filtered to your test client IP
start policy tracing -filterExpr "client.ip.src.eq(10.102.102.222)"

# Step 3: Send the test request from that client

# Step 4: View the results
show policy tracing

# Step 5: Stop the trace
stop policy tracing
SSL Virtual Server
For HTTPS or SSL vServers, add -protocolType SSL so the trace captures the correct protocol context:
// SSL vServer Trace
start policy tracing -filterExpr "client.ip.src.eq(10.102.102.222)"
                     -protocolType SSL
SSL Including Handshake Policies
To include SSL policies evaluated during the handshake itself, such as client certificate policies or SNI-based policies, add the -captureSSLHandshakePolicies flag:
// SSL Trace with Handshake Policies
start policy tracing -filterExpr "client.ip.src.eq(10.102.102.222)"
                     -protocolType SSL
                     -captureSSLHandshakePolicies yes
Reviewing a Specific Transaction
When multiple transactions are in the buffer, use brief mode first to identify the right one, then drill in:
// Reviewing a Specific Transaction
sh policy tracing

        Filter Expr        : CLIENT.IP.SRC.EQ(10.102.102.222)

1) Trace details:
        Client IP address:Port      : 10.102.102.222:39651
        Destination IP address:Port : 10.102.102.225:80
        Transaction ID              : 00000015-0e12-1671-a201-2628d9a7b0e7
        URL                         : /first_request
        Tracing start time          : Mon, 21 Oct 2024 09:20:36.119079000 GMT
        Packet engine id            : 1
        Policy Details:

                Request ContentSwitching: cs_pol_1
                Request URLTRANS: transform_pol
                Request Bot Management: bot_pol_1
                Request AppFw: app_pol
                Request Responder: resp_pol_1, resp_pol_2
                Request CACHE: cache_pol
                Request REWRITE: rw_pol
                Request LB: lb_pol
                Request Compression: cmp_pol_req_1
                Response REWRITE: rw_pol_1

2) Trace details:
        Client IP address:Port      : 10.102.102.222:57754
        Transaction ID              : 00000016-0e12-1671-a201-2628d9a7b0e7
        URL                         : /second_request
        Policy Details:

                Request ContentSwitching: cs_pol_2
                Request URLTRANS: No policy is evaluated to true
                Request Responder: resp_pol_3 (undef)
                Request REWRITE: No policy is evaluated to true
                Response REWRITE: No policy is evaluated to true
Reading the Trace Output
The trace output is organized by feature in the order in which each feature was evaluated during the transaction. This reflects the actual NetScaler processing pipeline, from Content Switching through Load Balancing on the request side, and through any response-side features on the way back.
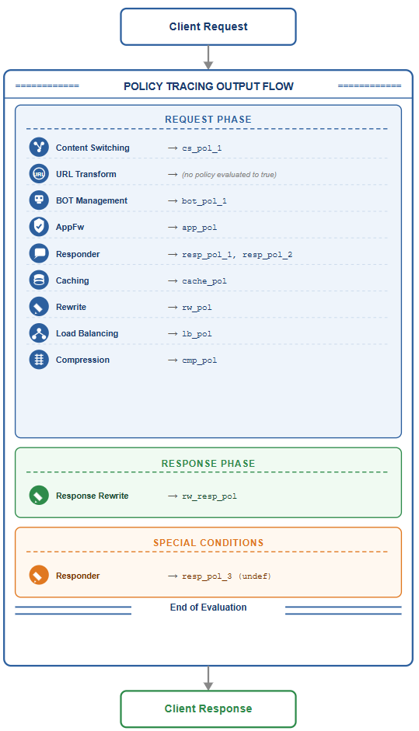
The documented evaluation order on the request side is:
- Content Switching
- URL Transform
- BOT Management
- Application Firewall (AppFw)
- Responder
- Caching
- Rewrite
- Load Balancing
- Compression
Response-side features (such as Response Rewrite) appear after the backend response is received.
Example Output
// Example Trace Output
# Request side
Request Content Switching: cs_pol_1
Request URL Transform: (no policy evaluated to true)
Request AppFw: No policy is evaluated to true
Request Responder: resp_pol_1, resp_pol_2
Request Rewrite: rw_add_security_header
Request Load Balancing: lb_persist_cookie

# Response side
Response Rewrite: rw_strip_server_header

# UNDEF example
Request Responder: resp_pol_3 (undef)
Interpreting the Output
| Pattern | Meaning | Action |
|---|---|---|
| pol_name listed | Policy expression matched: action was taken. | Confirm this is the policy that was expected to fire. |
| (no policy evaluated to true) | All policies under this feature evaluated to FALSE. | Check expressions, bind priorities, and bind point. |
| pol_name (undef) | Expression could not be evaluated: no action taken. | Add an .EXISTS guard to the expression. |
| Feature absent from output | Feature had no bound policies, or was not reached in the pipeline. | Check bind point and priority ordering. |
Understanding UNDEF
When (undef) is next to a policy name in the trace output, it means the policy engine attempted to evaluate that policy’s expression but could not complete the evaluation; as a result, no action was taken for that policy.
The trace output will show it like this:
// UNDEF in Trace Output
Request Responder: resp_pol_3 (undef)
Policy Tracing surfaces the UNDEF condition so administrators are aware that it happened, identifying the policy and the feature under which it occurred. Fixing the expression itself is outside the scope of Policy Tracing and will be covered in a future post on expression writing and UNDEF handling.
| WHAT TO DO IF I SEE UNDEF |
|---|
| Note the policy name and the feature under which it appears, then stop the trace. The expression for that policy needs to be reviewed, referring to data that was not present in the transaction (for example, missing headers, cookies, or attributes). Do not leave a policy with an UNDEF result in production without investigating it. |
Quick Reference Tips
The following table provides a quick reference for Policy Tracing tips.
| Command | Purpose |
|---|---|
| clear policy tracing | Reset buffer before a targeted test |
| start policy tracing -filterExpr “client.ip.src.eq(x.x.x.x)” | Start trace scoped to a client IP (HTTP) |
| start policy tracing -filterExpr “…” -protocolType SSL | Start trace for an SSL vServer |
| start policy tracing -filterExpr “…” -protocolType SSL -captureSSLHandshakePolicies yes | Include SSL handshake policy evaluation |
| show policy tracing -detail brief | List all captured transactions with IDs |
| show policy tracing -httpTransactionId <id> -detail all | Full evaluation detail for one transaction |
| stop policy tracing | Stop the active trace |
Key Takeaways
When performing your own Policy Tracing, it’s important to remember these key considerations:
- Always scope -filterExpr to a specific client IP address, as the buffer holds only 10 records per packet engine and fills fast on busy systems.
- Clear the buffer before each targeted test with clear policy tracing so there are no stale records from prior sessions.
- Use -detail brief first to identify the right transaction ID, then -detail all for the full evaluation chain.
- Output is organized by feature in evaluation order, to make it easier to find the target feature section (Rewrite, Responder, etc.) and look for the target policy name.
- (undef) next to a policy name means the expression failed evaluation; fix it with a null-safe.EXISTS guard.
- For SSL vServers, specifying -protocolType SSL ensures the correct protocol context is captured.
Policy Tracing is the most direct way to answer the question of what the NetScaler policy engine did with this request. By scoping the trace to a specific client IP address, clearing stale data before testing, and reading the feature-ordered output carefully, administrators can confirm correct behavior, isolate unexpected matches, and catch UNDEF conditions that would otherwise fail silently and go unnoticed.
Note that the CLI syntax covered in this blog is verified against the official NetScaler v13.1 and v14.1 documentation. Future posts in this series will cover the supporting toolkit, including stat counters, show commands, logging, and nstrace.
If you’re experiencing issues with your NetScaler environment, or simply don’t have the time or resources to manage it, Ferroque Systems can help. With decades of experience designing, deploying, optimizing, and securing NetScaler environments across enterprise, commercial, and government organizations, including FIPS-compliant deployments, our team is equipped to support environments of any size or complexity. We welcome the opportunity to work with you on your NetScaler deployment and would be happy to discuss how we can help.


