
Introduction
When it comes to troubleshooting, logs are your most valuable tool. In the Workspace ONE (WS1) ecosystem, WS1 Unified Endpoint Management (UEM) is the core component that manages your endpoint fleet. Each component that operates alongside WS1 UEM, from the AirWatch Cloud Connector (ACC), services deployed on the Unified Access Gateway (UAG), such as Omnissa Tunnel or Content Gateway, to the endpoint itself, writes detailed records of activity and errors. Knowing exactly where these logs live and how to collect them can be the difference between quickly resolving an issue and spending hours chasing symptoms. This guide walks through the key log locations across WS1 UEM and adjacent services so administrators and support teams can capture the right data fast and resolve issues with confidence.
Note: This guidance is based on Workspace ONE UEM version 2501.
Workspace ONE UEM Logs
WS1 UEM SaaS – Logs
Workspace ONE UEM (Unified Endpoint Management) in a SaaS deployment is hosted by Omnissa, which means administrators do not have direct access to server-side logs such as WS1 applications and console processing logs, web logs, or SQL logs. Only Omnissa Support has access to the full Workspace ONE UEM SaaS server-side logs.
Note: When administrators need Omnissa Support to investigate logs that are only available to Omnissa, they should open a support case, describe the issue clearly, and explicitly request a review of the backend logs for the SaaS environment. Omnissa Support will often schedule a troubleshooting session outside regular business hours, commonly around 5 pm local time, to enable debug logging in your tenant, reproduce the issue, and review the resulting logs.
However, the Workspace ONE UEM console includes tools and workflows that let administrators collect device and console logs to troubleshoot endpoint management issues.
Collect device troubleshooting logs from the WS1 UEM admin console
The console records device events that matter for troubleshooting. These logs help you track device activity, profile and app assignments, compliance checks, commands issued, enrollment events, and who initiated them.
Where to find it?
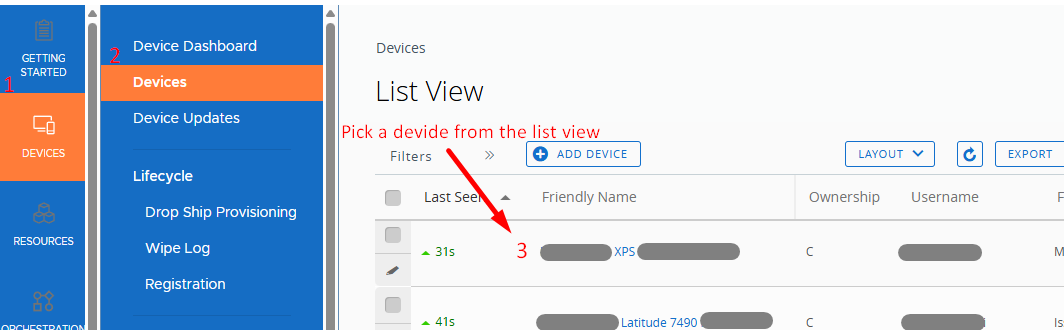
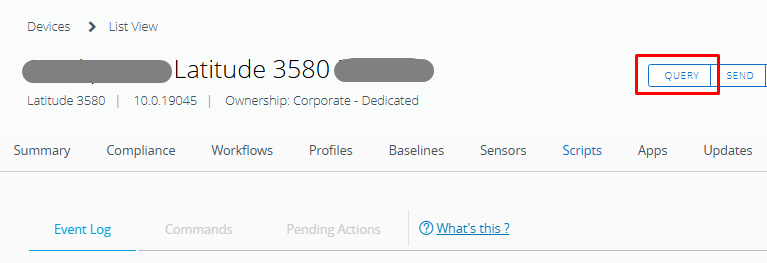
On the WS1 UEM admin console, navigate to Devices > List View > [Select Device] > More > Troubleshooting.
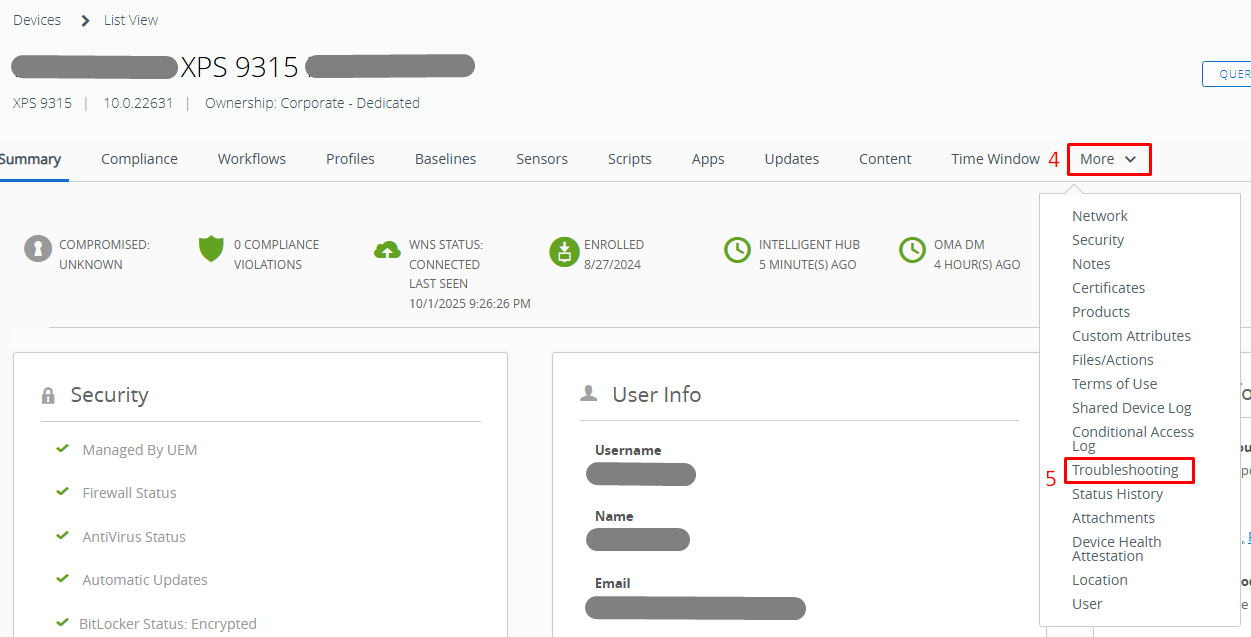
Device Troubleshooting Logs are primarily useful for tracking what actions were triggered on the device and by whom:
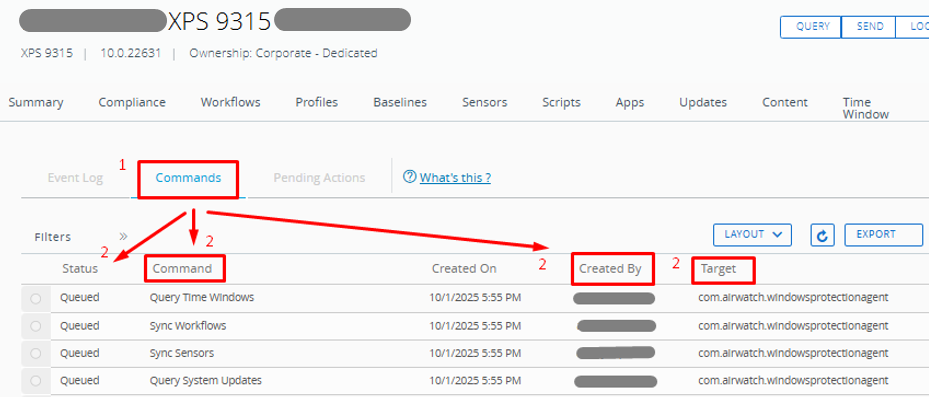
- Under the Commands tab, it shows the exact command(s) the console sent, who or what initiated it, the time of the request, and the returned status.
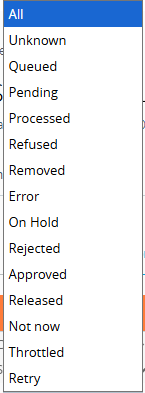
Administrators can monitor the status of WS1 UEM profile, application, and resource deployments to aid in troubleshooting and issue resolution. Command statuses include:
-
- Queued: The command is pushed to the device and is awaiting to land or to be consumed by the device.
- Pending: The command is being applied to the device and waiting for a response from the device.
- Processed: The device acknowledged and completed the command successfully.
- Refused: The device declined the command due to policy or user choice.
- Removed: The payload or app was removed from the device as instructed.
- Error: The device returned an error. Open the event to see the error text or code.
- On Hold: Command processing is paused for this device until released.
- Rejected: The server rejected the command, often due to a scope change or an invalid state.
- Approved: Command has been authorized for processing when approval is required.
- Released: Commands resume after being on hold.
- Not Now: The device asked the server to try later. Common on iOS when busy.
- Throttled: Processing is temporarily delayed due to rate limits or workload.
- Retry: The server will attempt the command again after a delay.
Note: Exact meanings and availability can vary slightly by platform and console version. In addition, when the Command tab is empty, it means all commands have been successfully consumed by the device.
- Under the Event Log tab, you can verify each step of application deployment. The grid shows install attempts, download and staging progress, installer return text or exit code, and any retry activity under the Event and Event Data columns.
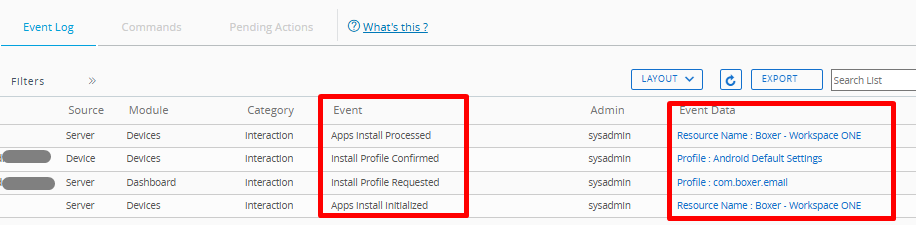
Similarly, for a WS1 UEM profile deployment, administrators can see assignments, install or remove actions, payload status, and any error text returned by the operating system.
For compliance events, administrators can see rule evaluations and any remediation taken.
Opening an event reveals raw details that are useful for troubleshooting.
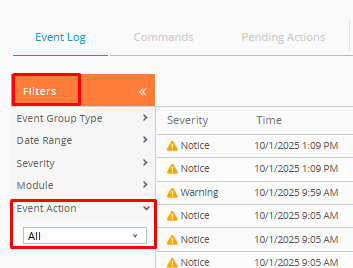
Use the Filters if necessary to focus on event actions such as App Install, Profile, Compliance, Command, and Enrollment.
Helpful specifics and practical tips
- Use the Query button on the device page to prompt an immediate check-in. It sends a push to the device to report status and execute queued commands, shortening the wait for scheduled check-ins. The query refreshes the app, profile, and compliance information from the device.
- Filter by Event and a tight time range, then reproduce the issue.
- Open an entry to see raw details such as timestamps, the initiating user or service, and the command identifier.
- Correlate entries with the Commands tab to confirm what was requested and how the device responded.
- Export to CSV when you need to attach evidence to a support case.
- Note the Device UUID, Organization Group, and console user, as support will ask for these details.
- If the device appears idle, check Last Seen. A stale check-in often explains missed installs. In that case, pair this view with device-side logs collected from Intelligent Hub.
Collect WS1 UEM admin console logs.
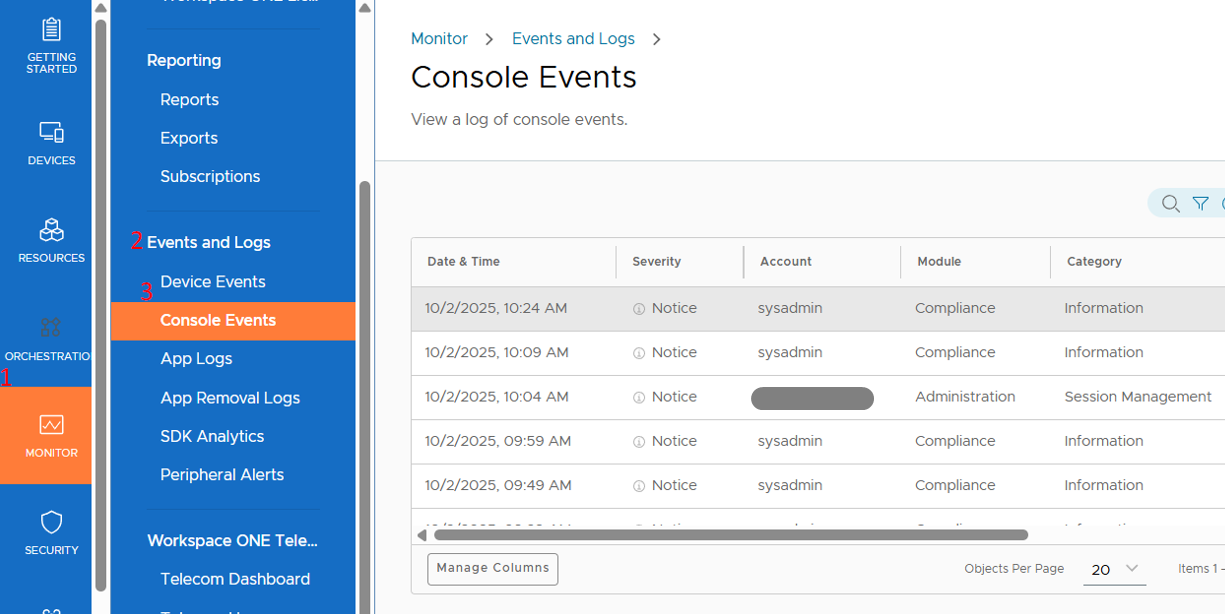
These track admin activities within the console and are useful for auditing and troubleshooting administrative actions. Actions such as logins, settings changes, profile and app assignments, smart group edits, device/enterprise wipes, and role or permission updates. Entries typically include who performed the action, when the action occurred, the target object, and the result. Availability of specific fields can vary by version.
Where to find it?
On the WS1 UEM admin console, navigate to Monitor > Events and Logs > Console Events.
How to use it in an issue investigation?
- Confirm who changed a profile or app assignment and the exact time.
- Correlate a device failure with a recent console action to determine the cause.
- Review failed logins or permission changes during security reviews.
- Export to CSV to attach evidence to a support case or change record.
Helpful specifics and practical tips
- Start with a tight time range around when the issue began.
- Add a username filter when you know who made the change.
WS1 UEM On-Premise Application Logs
In a WS1 UEM SaaS deployment, backend logs are available only to Omnissa Support as stated in the earlier section. For customers who host WS1 UEM on premises, administrators have direct access to the server-side logs generated by the WS1 UEM application and its services. These logs cover the admin console, device services, messaging, and scheduler services. They record device requests, console actions, API calls, background jobs, and application errors.
Having local access lets administrators adjust log levels, capture logs during an issue reproduction window, and correlate entries with device and console events for faster triage before opening a support case. Treat these logs as information, and be sure to adhere to your organization’s data-protection policies when handling them, since entries can include user identifiers, device identifiers, and network details.
Administrators should still use the device troubleshooting logs in an on-premises deployment. The WS1 UEM console exposes the same view described earlier, and it remains the first place to validate profile and application flow before administrators dive into server logs. Go to Devices > List View > select the device > More > Troubleshooting Log to see commands, status, who initiated the action, and the device response.
Helpful tie-ins with server logs:
- Use Query to trigger an immediate check-in so you can capture fresh entries while you watch the server logs.
- Align timestamps from the Troubleshooting Log with entries in the application, device services, and scheduler logs.
- Export the device troubleshooting log to CSV and attach it to your case notes along with the relevant server-side excerpts.
The next subsections outline the common log locations on the servers and the quickest ways to collect them. Most on-prem logs can be found in the C:\Airwatch\Logs directory as defined during installation of UEM, but each service has specific logs.
WS1 UEM – Device Services (DS) Logs
Purpose: The DS server manages device enrollment, MDM API calls, profile delivery, certificate requests, and communication with mobile devices.
DS Log Location on Windows Server:
- C:\AirWatch\Logs\DeviceServices\
Common files:
- DeviceServices.log (primary DS log)
- AirWatch.DeviceServices-<date>.log (rotated log)
- C:\inetpub\logs\LogFiles\W3SVC1\ (Site number may differ. These are critical for seeing inbound enrollment or MDM traffic at the IIS layer.)
WS1 UEM – Console Logs
Purpose: The Console server hosts the Workspace ONE UEM admin console (web UI) used by admins.
Location:
- C:\AirWatch\Logs\Console\
Common files:
- Console.log
- AirWatch.Console-<date>.log
- C:\inetpub\logs\LogFiles\W3SVC2\ (or whichever IIS site is bound to Console)
WS1 UEM – AWCM (AirWatch Cloud Messaging) Logs
Purpose: AWCM is the persistent channel between devices and UEM for push notifications and commands (apps to install, lock/wipe requests, compliance actions).
Location:
- C:\AirWatch\Logs\AWCM\
Common files:
- AWCM.log
- AirWatch.AWCM-<date>.log
- Service Logs: AWCM runs as a Windows service. Check Services.msc (AirWatch Cloud Messaging Service) and Windows Event Viewer if it is failing to start.
General & Supporting Logs
Windows Event Logs: Always collect Application and System event logs.
Omnissa Workspace ONE Installer Logs: If recent upgrades/patches were applied, collect installer logs from:
- C:\\Logs\Install\
WS1 UEM – Connector and Gateway Logs On Premises
Many WS1 UEM deployments and architectures include hosted connectors and edge services that work with WS1 UEM. This applies whether the customers’ WS1 UEM is SaaS or on-premises. Because these components run in the customers’ environment, these logs are available locally and are often the fastest way to isolate network, authentication, or data path issues.
Airwatch Cloud Connector (ACC) Logs
ACC is a lightweight Windows service that runs inside the customer network and establishes a secure outbound connection to WS1 UEM. It allows UEM to use internal enterprise services without opening inbound firewall ports. In practice, it bridges the UEM console to resources that reside behind the customer firewall.
What it enables:
- Directory Services: Sync users and groups from Active Directory or LDAP, authenticate users during enrollment and self-service log in, and perform password validation where configured.
- Certificate Authorities: Integrate with Microsoft AD CS and other PKI to issue, renew, and revoke device and user certificates through SCEP or native connectors for Wi Fi, VPN, and app authentication.
- Offline Domain Join (ODJ): Generate and deliver domain join blobs so Windows devices can join the domain without line of sight, useful during provisioning and remote deployments.
- Email SMTP: Use internal SMTP for console notifications and leverage other supported integrations that require access to premises systems.
These services are just an example of common services that can be employed on the ACC server(s). Not every environment uses every ACC capability; administrators should confirm which ACC services are deployed and enabled, then target troubleshooting on those specific flows.
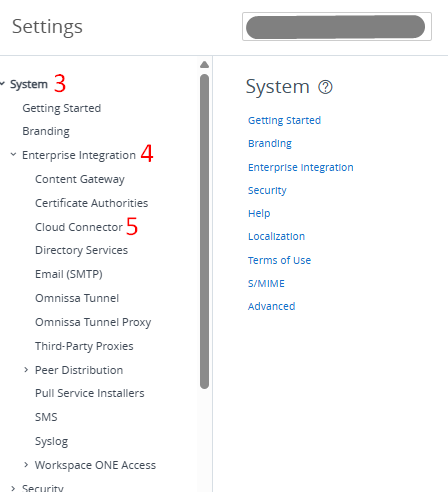
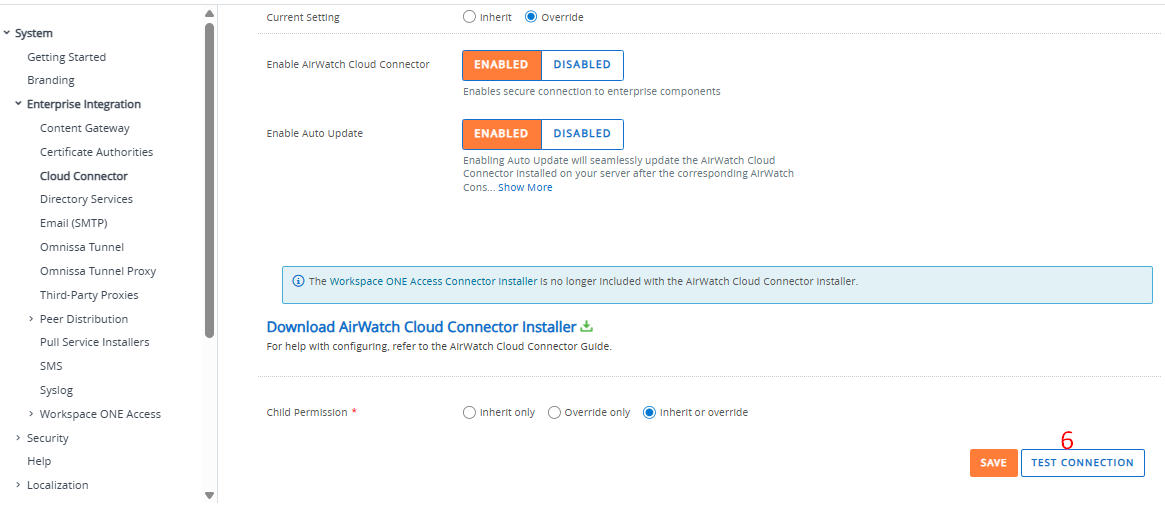
If ACC is unavailable, directory sync, authentication, certificate issuance, and ODJ workflows will stall or queue. Verifying ACC health is a primary check during troubleshooting by accessing the WS1 UEM console, navigating to Groups & Settings > Systems > Enterprise Integration > Cloud Connector > Test Connection.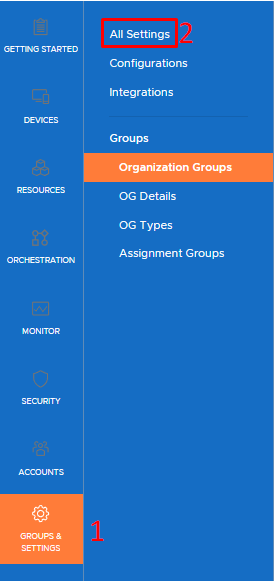
Where to find the ACC logs?
- The ACC log files are stored locally on the server that has ACC services installed. Administrators can find the primary log files in the following directory: C:\AirWatch\Logs\CloudConnector\
- Inside this folder, administrators will typically find the following files and folders relevant to ACC:
- CloudConnector.log – The main log file that records communication between the ACC and the Workspace ONE UEM cloud.
- CloudConnector-xx.log – rotated logs
- Inside this folder, administrators will typically find the following files and folders relevant to ACC:
- It is also important to check that log verbosity is set appropriately for troubleshooting needs. By default, the ACC logs are not highly verbose. Administrators can increase logging detail via the ACC Configuration config file, which is found at: C:\AirWatch\CloudConnector\Bank#\
- The ACC uses two banks, and when switching the logs to verbose, it can be difficult to tell which is the active bank, so you can either check which bank is empty, or just verbose the config file in both. In the bank folder you will find the config file called: CloudConnector.exe.config
- Within this config file, you can change the level =”info” and increase the logging level (e.g., to debug or verbose). Make sure to restart the AirWatch Cloud Connector service for the changes to take effect.
Unified Access Gateway is a hardened appliance that sits at the network edge and provides a secure entry point for Workspace ONE services. It brokers device traffic from the Internet to internal resources, terminates TLS, and applies authentication and transport controls. UAG can host services such as Omnissa Tunnel, Content Gateway, and Secure Email Gateway.
Which services are present depends on the customer deployment. Administrators should confirm which services are enabled on the appliance and focus log collection on those components when troubleshooting. Logs from UAG are especially useful for isolating network, certificate, and backend connectivity issues that affect app access, content access, or email flow.
Where to find the UAG logs?
Method A – Collecting Logs via the UAG Admin UI
Omnissa makes it easier to collect logs without manual SSH by using the built-in admin interface:
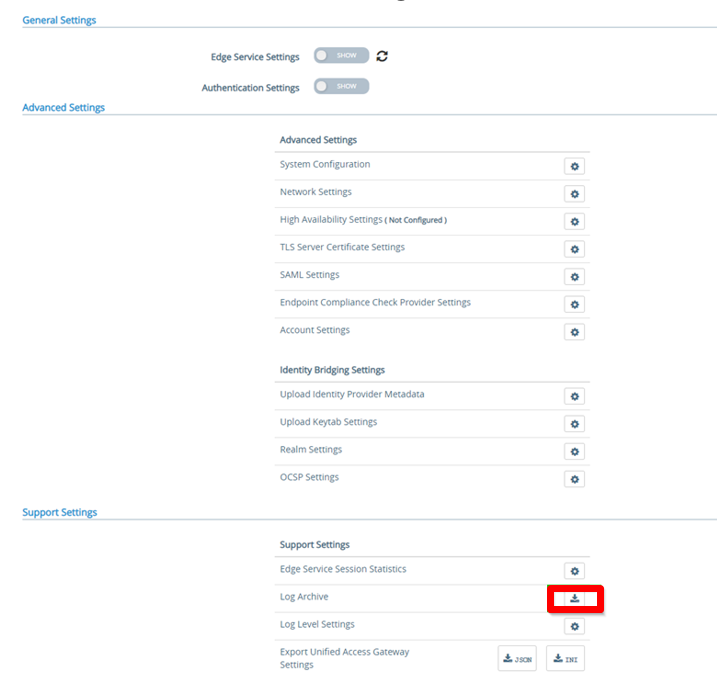
Log in to the UAG Admin UI (https://<UAG-FQDN>:9443/admin) > go to Support Settings → click on Log Archive > click Collect Logs > This generates a compressed archive (.tar.gz) of all UAG logs, which administrators can then download.
Method B – SSH / manual file collection
- SSH to the appliance with the management/admin account:
- Become root if necessary: sudo -i or sudo su -.
- Navigate to the log directory:
cd /opt/Omnissa/gateway/logs/
- Export logs to a file for download:
tar -czvf /tmp/uag_logs.tar.gz
Note: Depending on the version of the UAG, the Omnissa folder may be replaced with a folder in older versions.
How to enable detailed (debug) logging?
Sometimes INFO-level logs are not enough. To increase verbosity:
Log in the UAG and select Configure Manually > navigate to Support Settings > Log Level Settings.
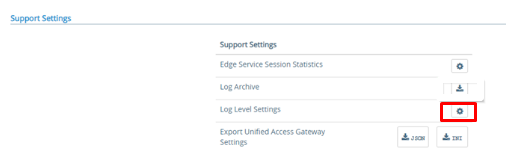
On the Log Level Settings window, configure the log level for the desired Unified Access Gateway component and sub-component.
- In the first drop-down box, select the component and sub-component.
- All indicates that the configured log level is applied to the entire Unified Access Gateway appliance.
- Admin indicates that the configured log level is applied to the admin UI component of Unified Access Gateway.
- Horizon Edge Service has sub-components such as XMLAPI, BLAST, TUNNEL, and so on.
- A log level can be applied to the entire Horizon edge service by choosing Horizon Edge Service-All.
- In the second drop-down box, select the log level. Administrators can configure multiple level settings for the supported components and sub-components of Unified Access Gateway.
- For example: If administrators can select the component as All and log level as INFO, then administrators can collect information messages that highlight the progress of the Unified Access Gateway services for the entire appliance. In addition to this setting, administrators can configure another log level, ERROR for the entire Horizon edge service or for specific sub-components such as BLAST, TUNNEL, and so on.
Workspace ONE Tunnel Logs on the UAG
Just like general UAG logging, the admin UI has an option to export a support bundle which includes the Tunnel logs if the service is enabled.
- Log into the UAG admin console (https://<uag-fqdn>:9443 by default) > navigate to System Configuration > Support Settings > click Download Support Bundle > download the generated tar file, it will contain subdirectories for each enabled service, including tunnel. The tunnel logs will be contained in an additional tar file called tunnel_snap.tar.
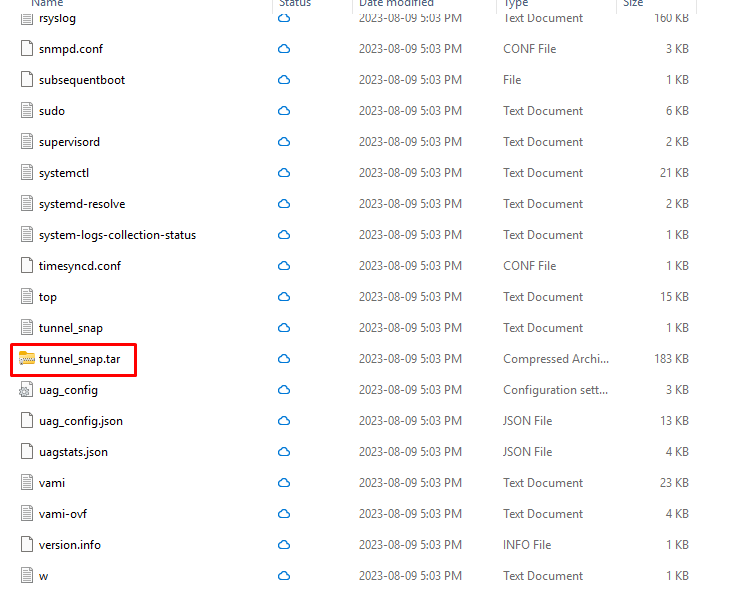
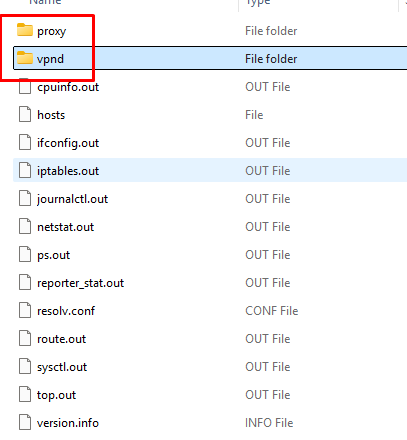
Unzip the tunnel_snap.tar file to access the tunnel log bundle. Once unzipped, the folders will contain two subfolder vpnd and proxy. Tunnel logs reside in the vpnd folder.
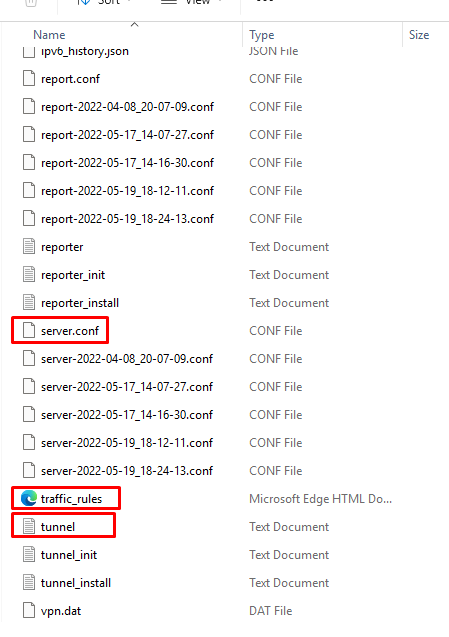
- This bundle typically includes:
- Tunnel (main service log)
- log.<number> (rotated history)
- conf file is the configuration JSONs for Tunnel service (so you can check ports, certs, and destinations).
- Traffic_rules (the deployed device traffic rules)
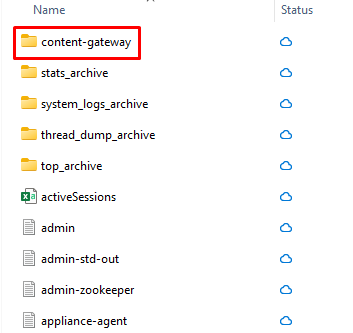
Workspace ONE Content Gateway Logs on the UAG
Just like how administrators collect Tunnel logs on the UAG, administrators can collect the UAG logs first then locate the Content Gateway logs within the downloaded bundle.
- Log in to the UAG Admin UI (https://<uag-fqdn>:9443) > go to System Configuration > Support Settings > click Download Log Archive > download the tar file.
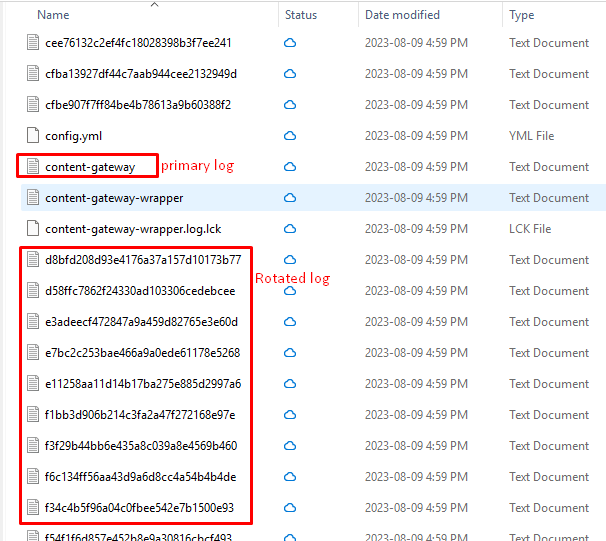
- Inside, administrators will find a content-gateway subdirectory that contains:
- Content-gateway file – the primary log.
- Rotated logs (e.g., contentgateway.log.1 or random number depending on the deployed UAG versions).
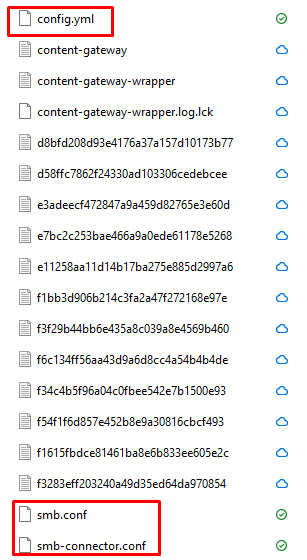
- yml – content gateway configuration and log level details
- Smb-connector.conf – SMB protocol and log level details
Workspace ONE Secure Email Gateway (SEGv2) Logs on the UAG
When the SEG is deployed on a UAG appliance it runs in a containerized microservice format inside the hardened Linux OS of the UAG. These logs are stored locally on the UAG file system and can be accessed via SSH or by downloading via the UAG admin console.
How to Download SEG Logs from UAG Admin Console?
If administrators prefer not to SSH into the appliance, UAG provides a way to download logs via the web-based admin console which is like the method of collecting the tunnel.
- Log in to the UAG Admin UI (https://<uag-fqdn>:9443) > go to System Configuration > Support Settings > click Download Log Archive > download the tar file. This downloads a tar.gz archive that contains all logs for the UAG appliance, including SEG logs.
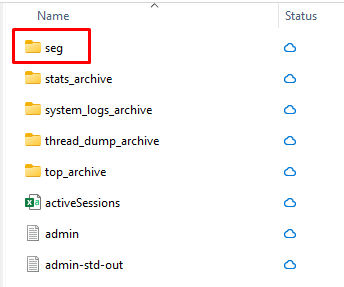
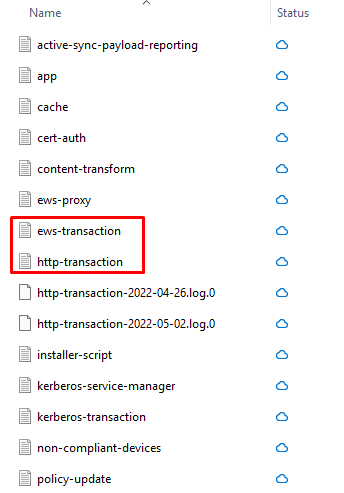
- Inside, administrators will find a SEG subdirectory that contains:
- SEG logs pertain to these files ews-transation, https-transaction, app, policy-updates, etc.
Device-Based Logs
Finding and retrieving the logs from devices can often be tricky, especially from mobile devices. In this blog we will only go over mobile devices, as obtaining WS1 UEM logs for Windows and Mac is another topic in itself.
iOS Devices
How the user can send iOS device logs via Workspace ONE Intelligent Hub
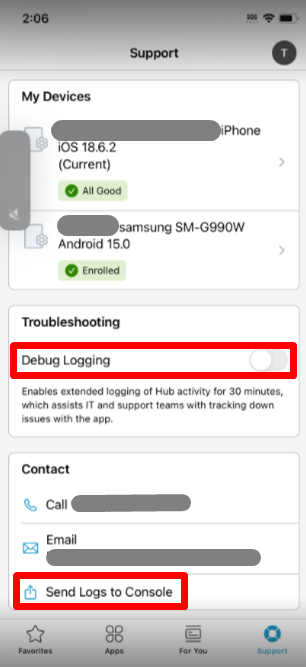
The Workspace ONE Intelligent Hub for iOS includes a built-in feature that allows users to collect and send logs from the device:
- Open the Workspace ONE Intelligent Hub app on the iOS device.
- Go to Support at the bottom.
- Enable Debug Logging.
- Tap “Send Logs to Console.”
Collecting The Sent iOS Device Logs via WS1 UEM Admin Console
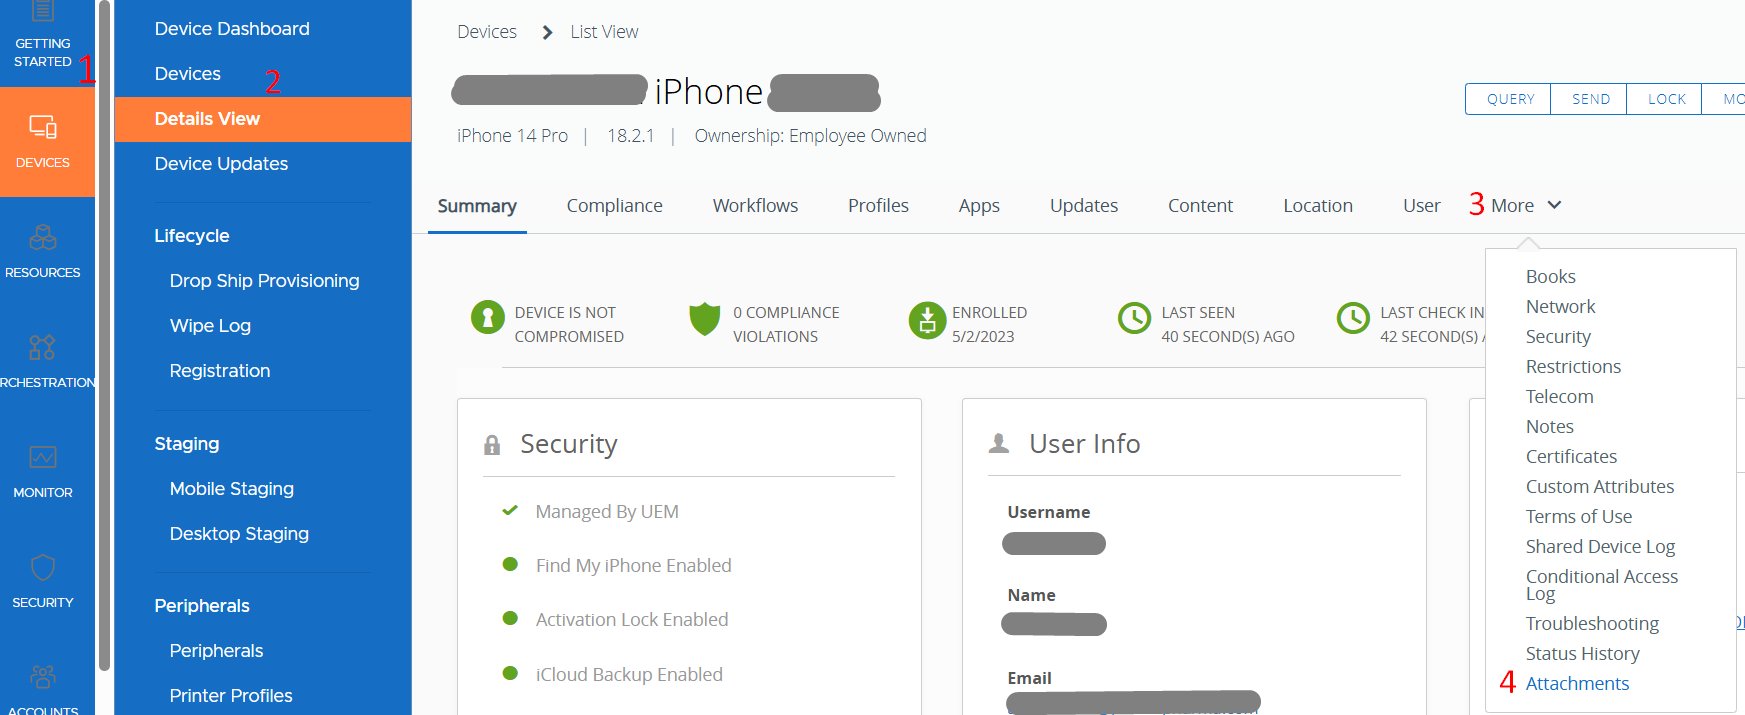
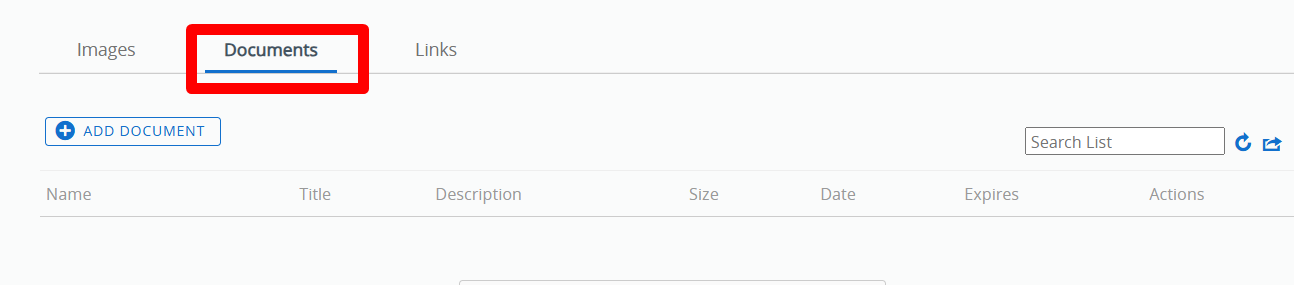
- Log into the WS1 UEM console and go to Devices > Devices > [Select the iOS Device] > More > Attachments > Documents.
- The sent file initiated by the end user via the Intelligent Hub app will appear under the Documents tab > Download the com.air-watch.agent_<date>.zip file.
Using Apple Configurator or Xcode
At times, Omnissa Support will ask for, or you may want to get more detailed raw iOS device logs to see what the operating system reports during enrollment, MDM command processing, app installs, or network events. Console and Hub logs do not include the full Apple Unified Logging stream. Using Apple Configurator or Xcode on a Mac lets administrators live stream and export device logs while reproducing the issue, giving Support precise timestamps and errors to correlate with server-side logs.
Apple Configurator (installed on macOS):
- Install Apple Configurator
- Connect the iOS device via USB.
- Connect your iOS device via USB. The device should appear in the main window.
- Select the connected device.
- Go to the Menu > Actions > Advanced > Get Logs… (or right-click the device > Get Logs).
- Choose the type of logs you want to collect:
- All Logs: including system, crash, and app logs.
- Crash Logs: useful if Intelligent Hub or any Workspace ONE managed app is crashing.
- Console Logs: shows real-time events.
- Click Next, and Apple Configurator will pull the logs from the device.
- Save the logs to a known location on your Mac. The logs are usually saved in .ips or .log files.
Xcode (installed on macOS):
- Install Xcode from the Mac App Store.
- Connect the iOS device via USB.
- Open Xcode on your Mac.
- Navigate to the menu: Window > Devices and Simulators.
- In the Devices tab, select the connected iOS device from the list. The device must be unlocked.
- At the bottom of the device window, you will see a console log viewer that streams real-time system and app logs.
- To capture logs for Workspace ONE Intelligent Hub: Open the Hub app on the device and reproduce the issue.
- Watch the logs in real-time for error messages or warnings related to com.airwatch.hub (the app bundle identifier).
- You can select all logs and copy or save them using the Save Console Output button (export as .txt).
Android Devices
Collecting Android Device Logs via the Intelligent Hub
On Android Enterprise-managed devices, the Workspace ONE Intelligent Hub acts as the agent for management and is the primary source of logs.
- Open the Workspace ONE Intelligent Hub app on the Android device.
- Tap “Support” at the bottom.
- Select “Send Logs.” The logs will be sent to the console.
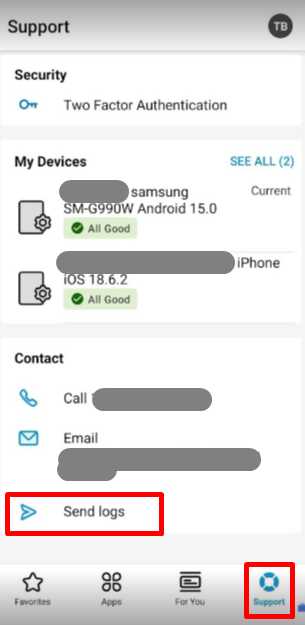
- Log into the WS1 UEM console and go to Devices > Devices > [Select the Android Device] > More > Attachments > Documents >Download the com.airwatch.androidagent-multilog.zip file.
- In the file, administrators will find a few log files:
- Hub<device_string>: Main log for the Intelligent Hub.
- Profiles<date>: UEM profile status for the device.
- ConfigFile: Summary of device state.
Logs from Device Side via File System
If direct access to the device’s file system is allowed, logs can be manually retrieved using Android Debug Bridge (ADB).
Collect Android Logs via ADB (Android Debug Bridge):
- On a Windows or Mac machine, download and install the Android SDK Platform Tools from: https://developer.android.com/studio/releases/platform-tools. This will install ADB on your machine.
- Connect the Android device via USB.
- On the Android device enable Developer Options. (This step varies depending on the Android version but is usually as follows.)
- Go to Settings > About Phone > Build Number
- Tap Build number 7 times.
- Enable USB Debugging on the Android device.
- In Command prompt on your connected Windows or Mac device run:
- adb devices
- The device should appear as “authorized.” If it shows “unauthorized,” accept the USB debugging prompt on the device.
- Run:
- adb logcat -d > android_logs.txt
- A log file will be created in your current working directory called android_logs.txt.
WS1 UEM Admin Console Log Collection Requests
The WS1 UEM Console (SaaS or On-Prem) allows for remote log collection as well.
- Log into the WS1 UEM console and go to Devices > Devices > [Select the Device] > under More Actions, select “Request Device Log”.
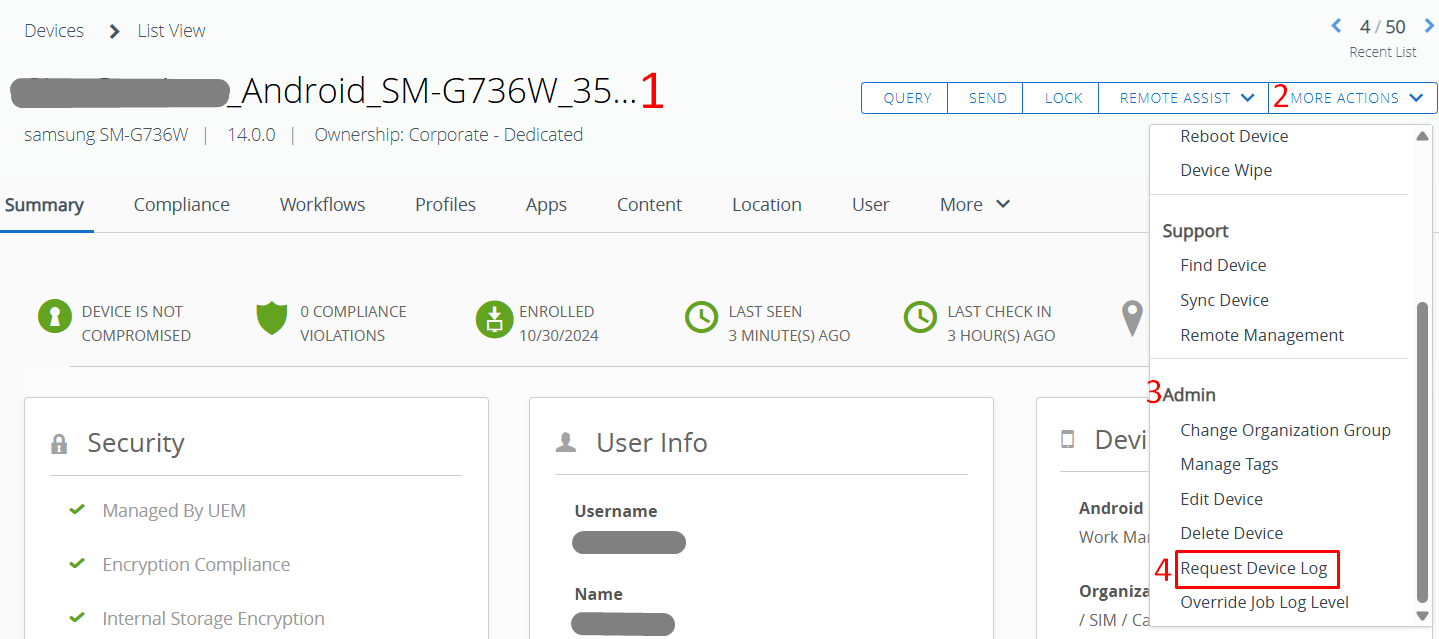
- The log request is pushed to the device, and once the device responds, the logs will be uploaded to the console and made available for download.
- The logs are visible under More > Attachments.
In Conclusion…
Knowing where to find the right logs across Workspace ONE components is essential for fast, effective troubleshooting. Whether you are working with UAG services like Tunnel and Content Gateway or on-premises UEM servers such as Device Services, Console, AWCM, and the database, each has its own dedicated log paths. By having a clear reference of these locations and collecting the right set of logs up front, you can streamline root-cause analysis and reduce time to resolution.


